Step 1: Run tests and compare results from XPRESSO dashboard
Value Proposition: In today’s fast-paced business environment, efficiency and agility are crucial for success. The XPRESSO dashboard empowers organizations to streamline their testing processes, enabling rapid identification and resolution of network issues. By leveraging XPRESSO’s powerful capabilities, businesses can minimize downtime, enhance customer satisfaction, and maintain a competitive edge.
With XPRESSO, network administrators can execute pre-configured test jobs, monitor their execution status in real-time, and quickly identify potential failures or deviations from expected behavior. Furthermore, XPRESSO’s advanced comparison features allow for in-depth analysis of test results, facilitating root cause analysis and informed decision-making.
Launch a web browser within your Remote Desktop Protocol (RDP) session and navigate to
http://xpresso.dcloud-cisco.com. The system will redirect you to the XPRESSO login page.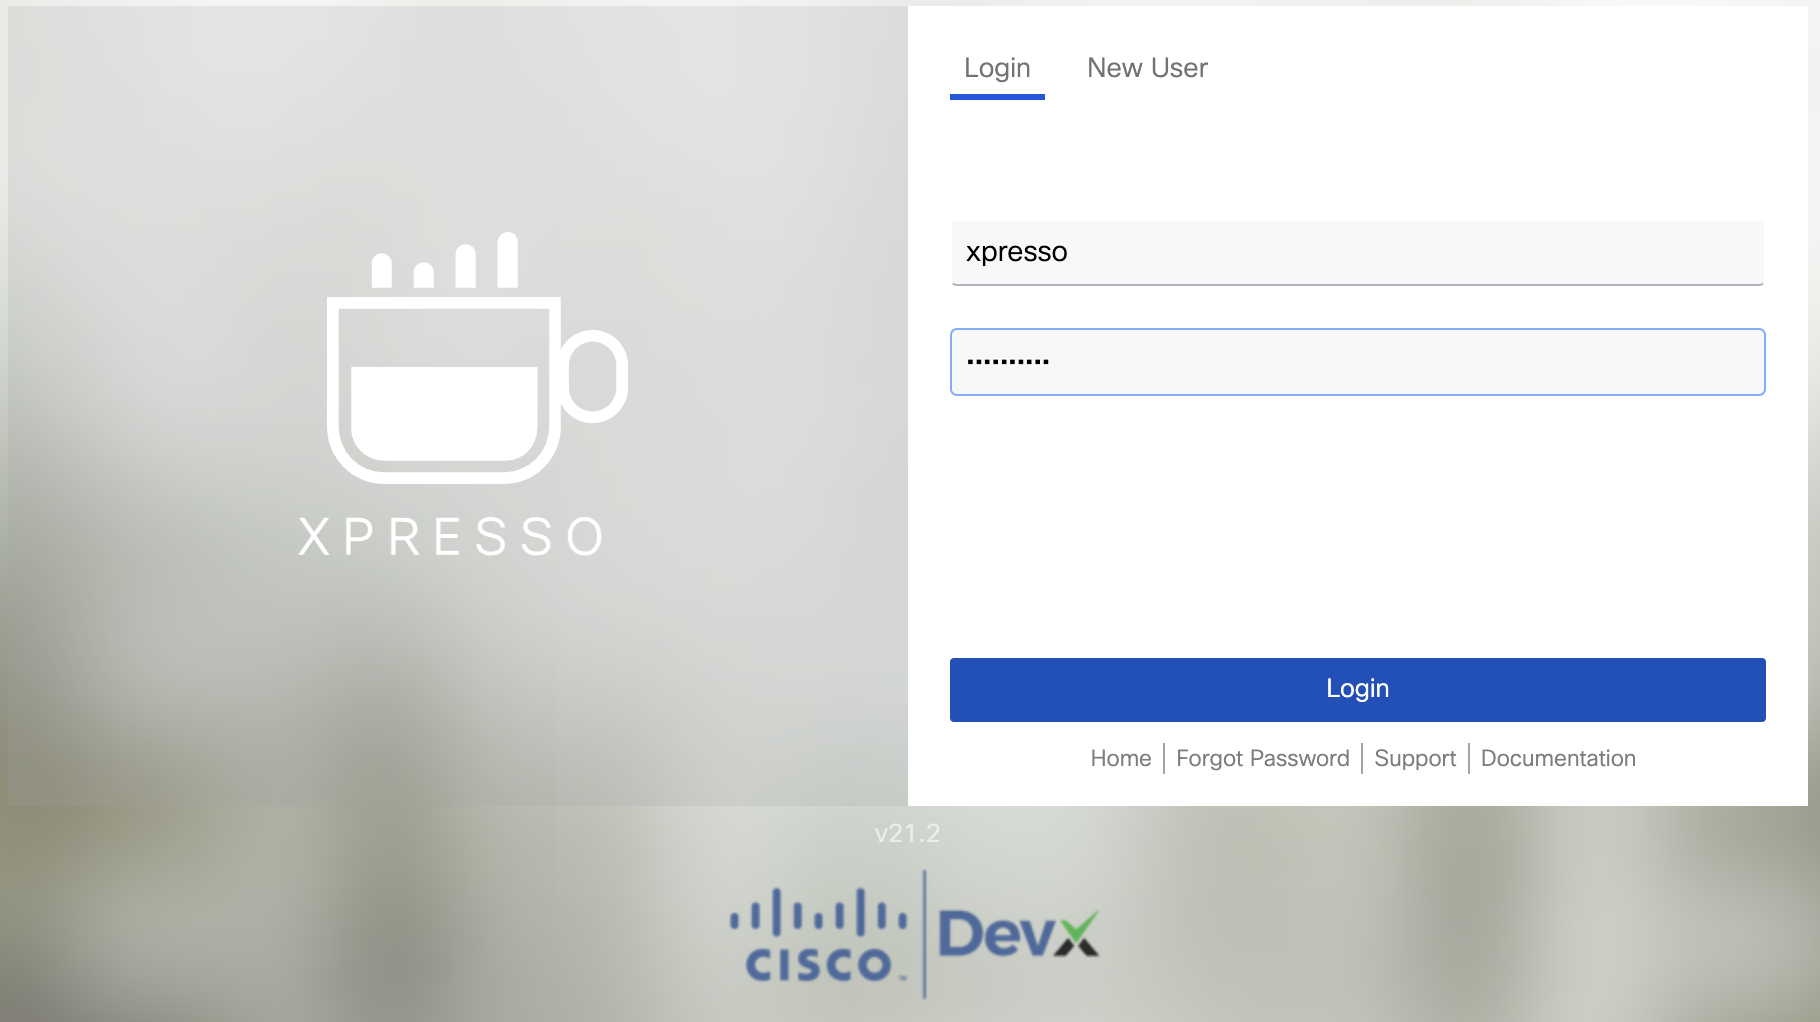
Tip
If you are connected to the VPN, you can access XPRESSO dashboard directly from your PC. Open the browser and navigate to
http://198.18.134.50and login with the following credentials:Username:
xpressoPassword:
C1sco12345
Upon logging in, the XPRESSO dashboard will display with the Jobs section automatically selected. This section provides a comprehensive overview of all previously executed jobs, allowing you to track and review your workflow history. Each job entry shows its execution status, timestamp, and relevant details.
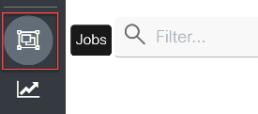
From the menu icons on the left, locate the Jobs item and click on it:
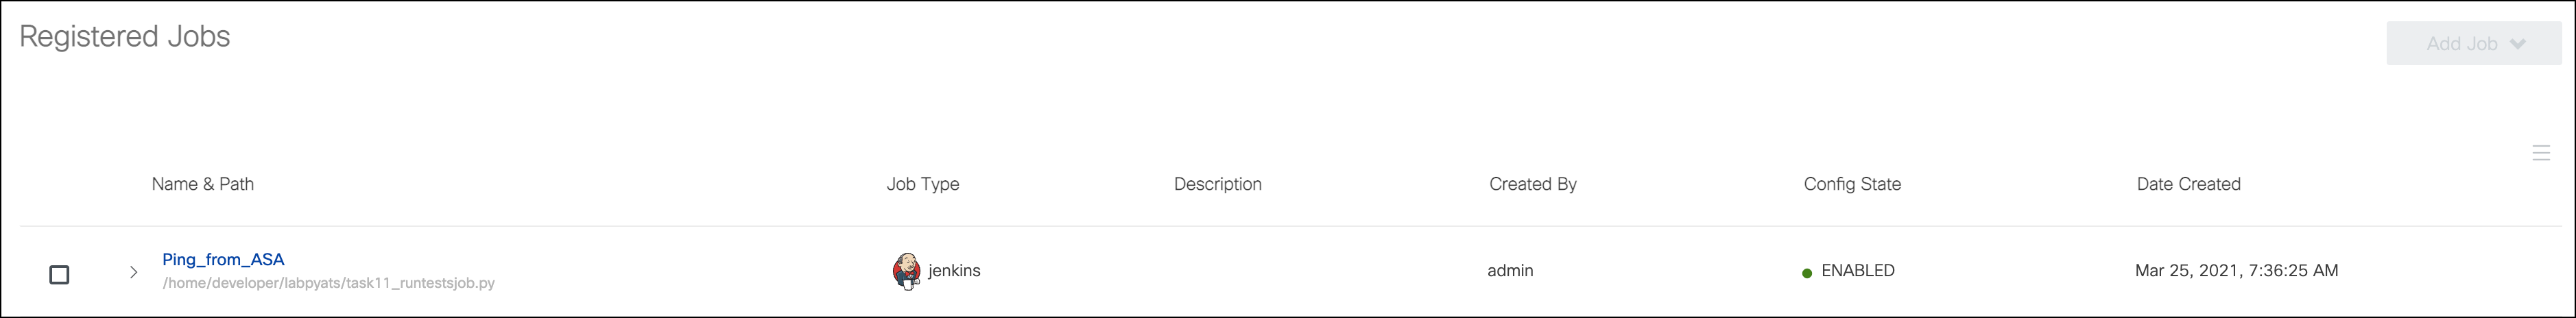
You will see the pre-configured job Ping_from_ASA which executes task3step4.py script you’ve used in this Scenario:
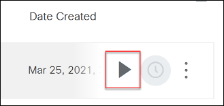
Hover your mouse over the job row and you will see the Execute icon on the right. Click it:
You will be presented with a
You are configuring a new group job requestpage where you can customize job run settings. Leave all settings by default and click the Submit button. Once done, the job will be submitted for execution.At the bottom of the job execution page, you will see the
requestitem, which will go through the different stages: PREPARING, QUEUING, QUEUED, RUNNING, PASSED, ERRORED, or FAILED:
Click on the Request Item while the job is running, and you will see how pyATS is executing every test defined in the job file one by one in real-time:
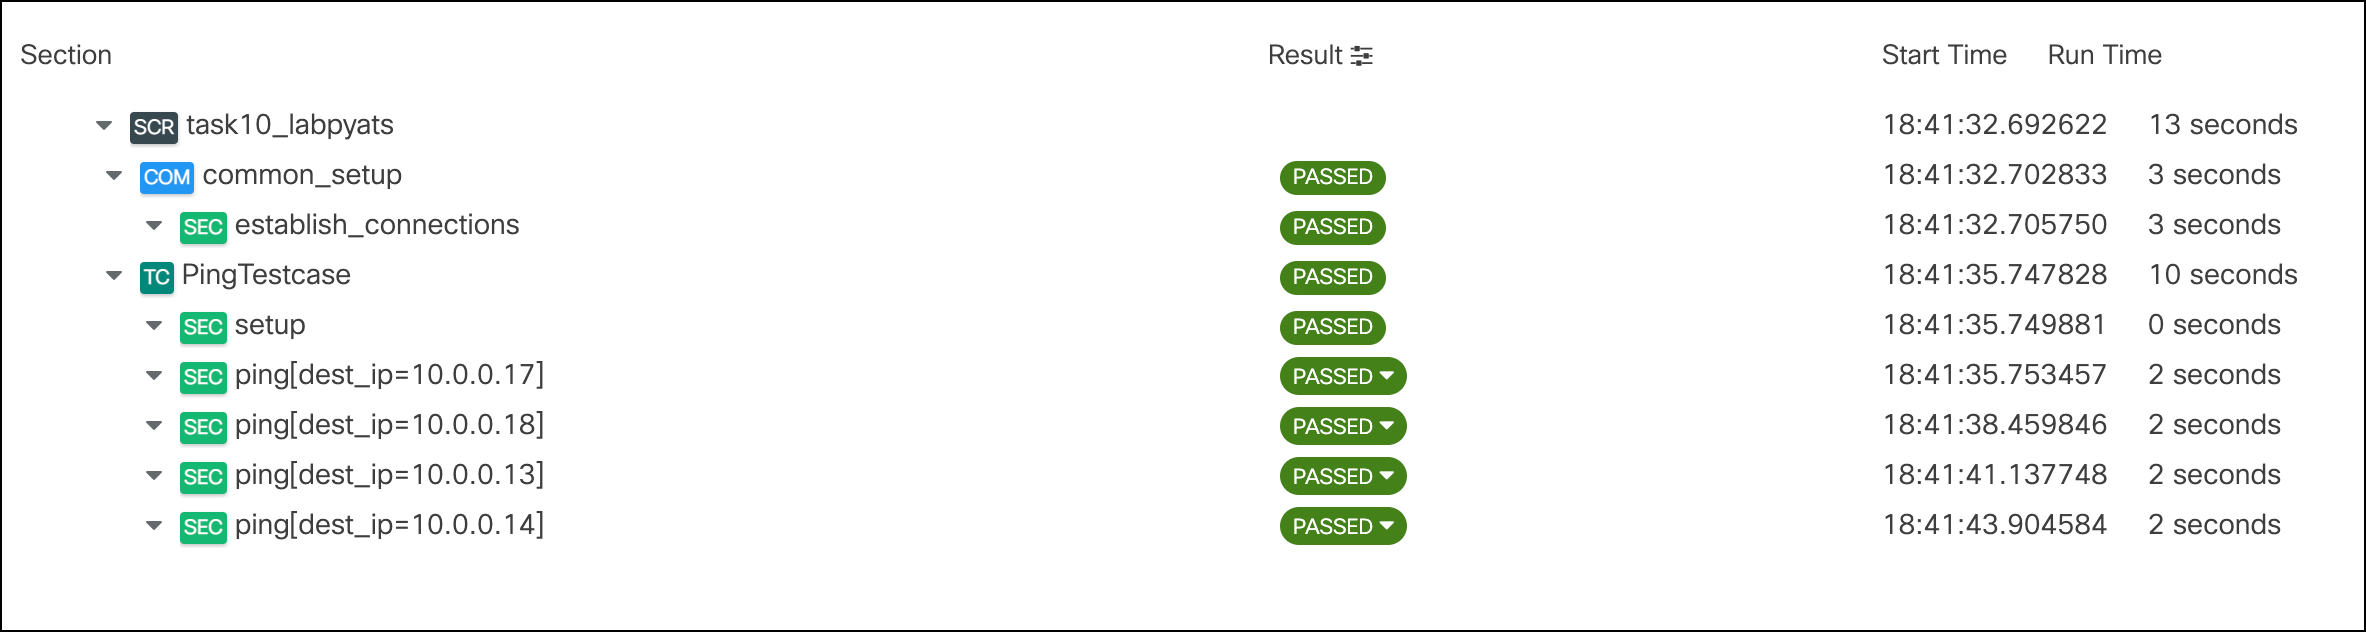
Note
If you click on the
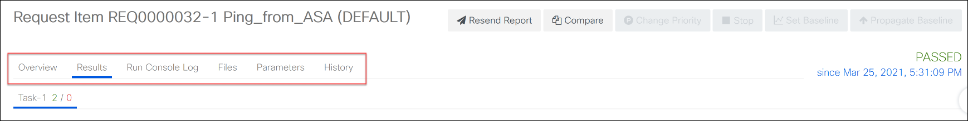
requestitem while the job is going through PREPARING, QUEUING, QUEUED stages, there will be no visible results as the job is not running yet. Once the job transitions to the RUNNING stage, the page will be updated and you will start getting test the execution results,Once job execution is completed, you will see the results, can check raw console output, job history with timestamps, download archive with results, or compare test execution with another job run:
Let’s introduce a network failure by connecting to csr1000v-1 and shutting down interface GigabitEthernet2. From Admin Workstation launch Putty, login to csr1000v-1, and execute commands:
configure terminal
interface gigabitEthernet 2
shutdown
Go back to the XPRESSO dashboard and click on the Jobs menu item:
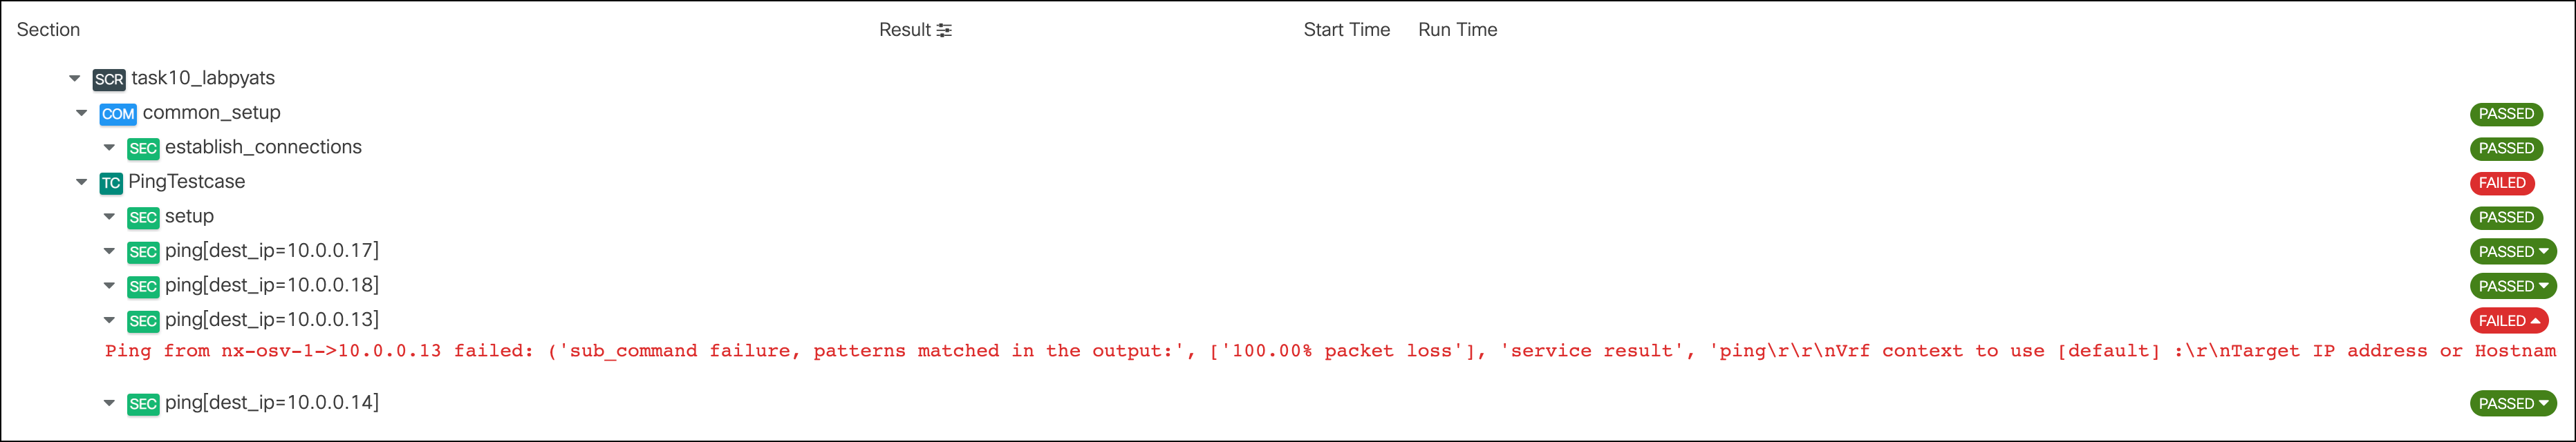
Run Ping_from_ASA job again by repeating Steps 4 - 7. This time you will notice that one of the tests is failing:
Now let’s compare job results. On the top of the page click on the Compare button and check the last job run that was successful and has the status PASSED:
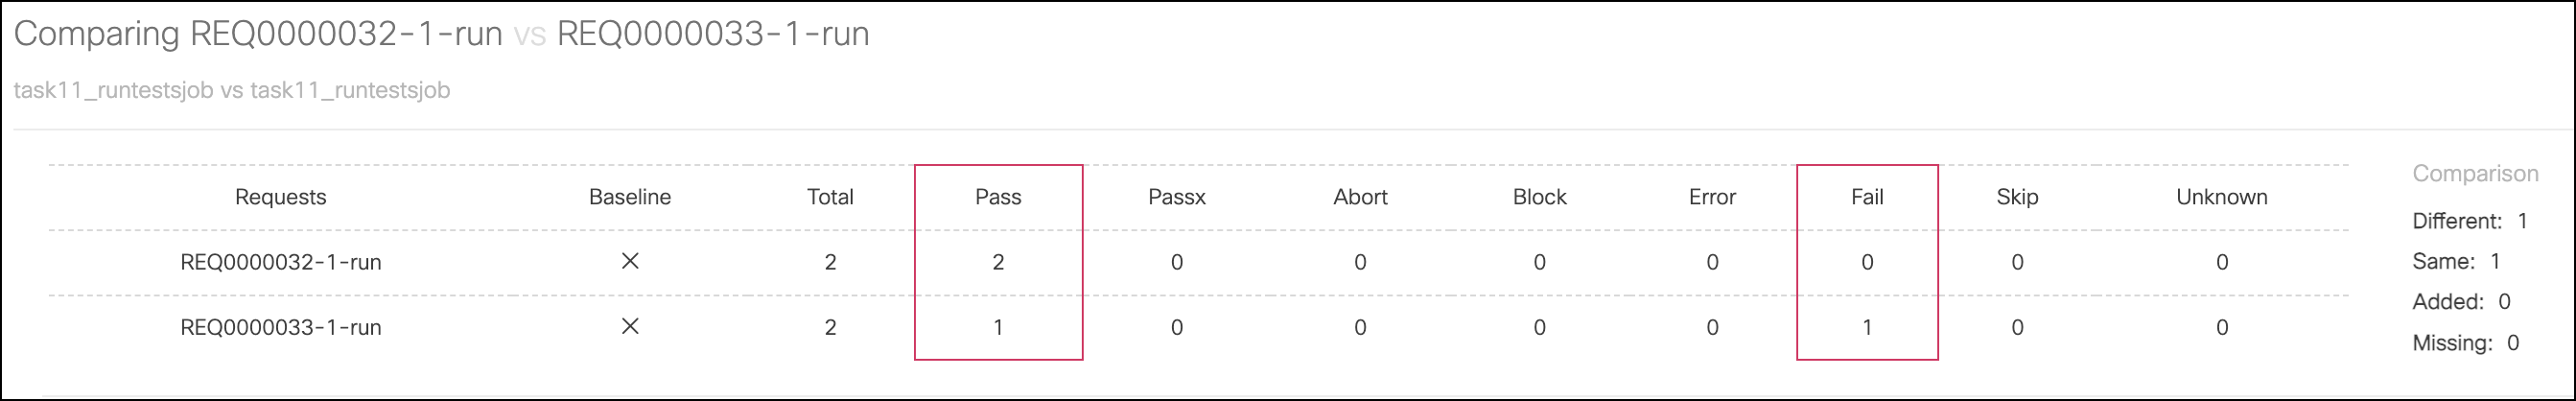
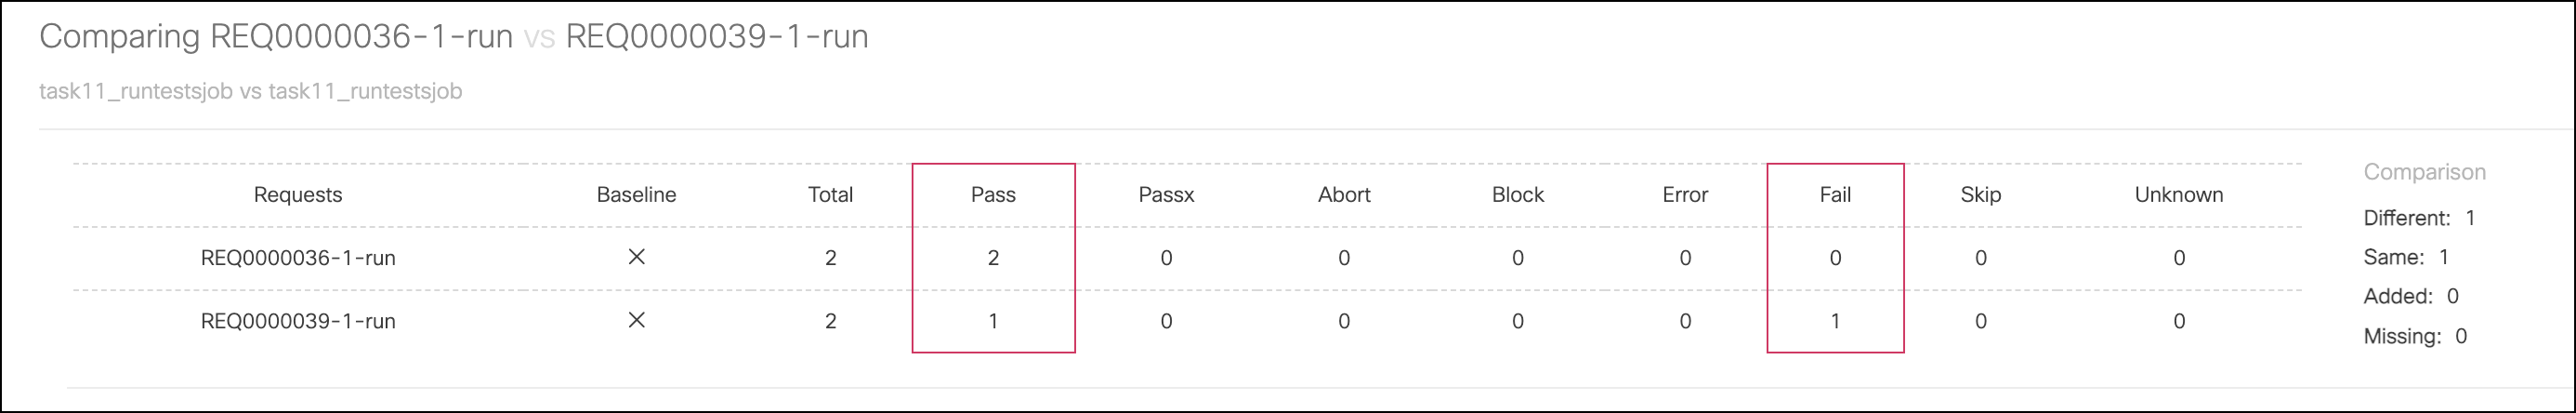
You will see the summary of the comparison for both job runs and a number of passed and failed tests:
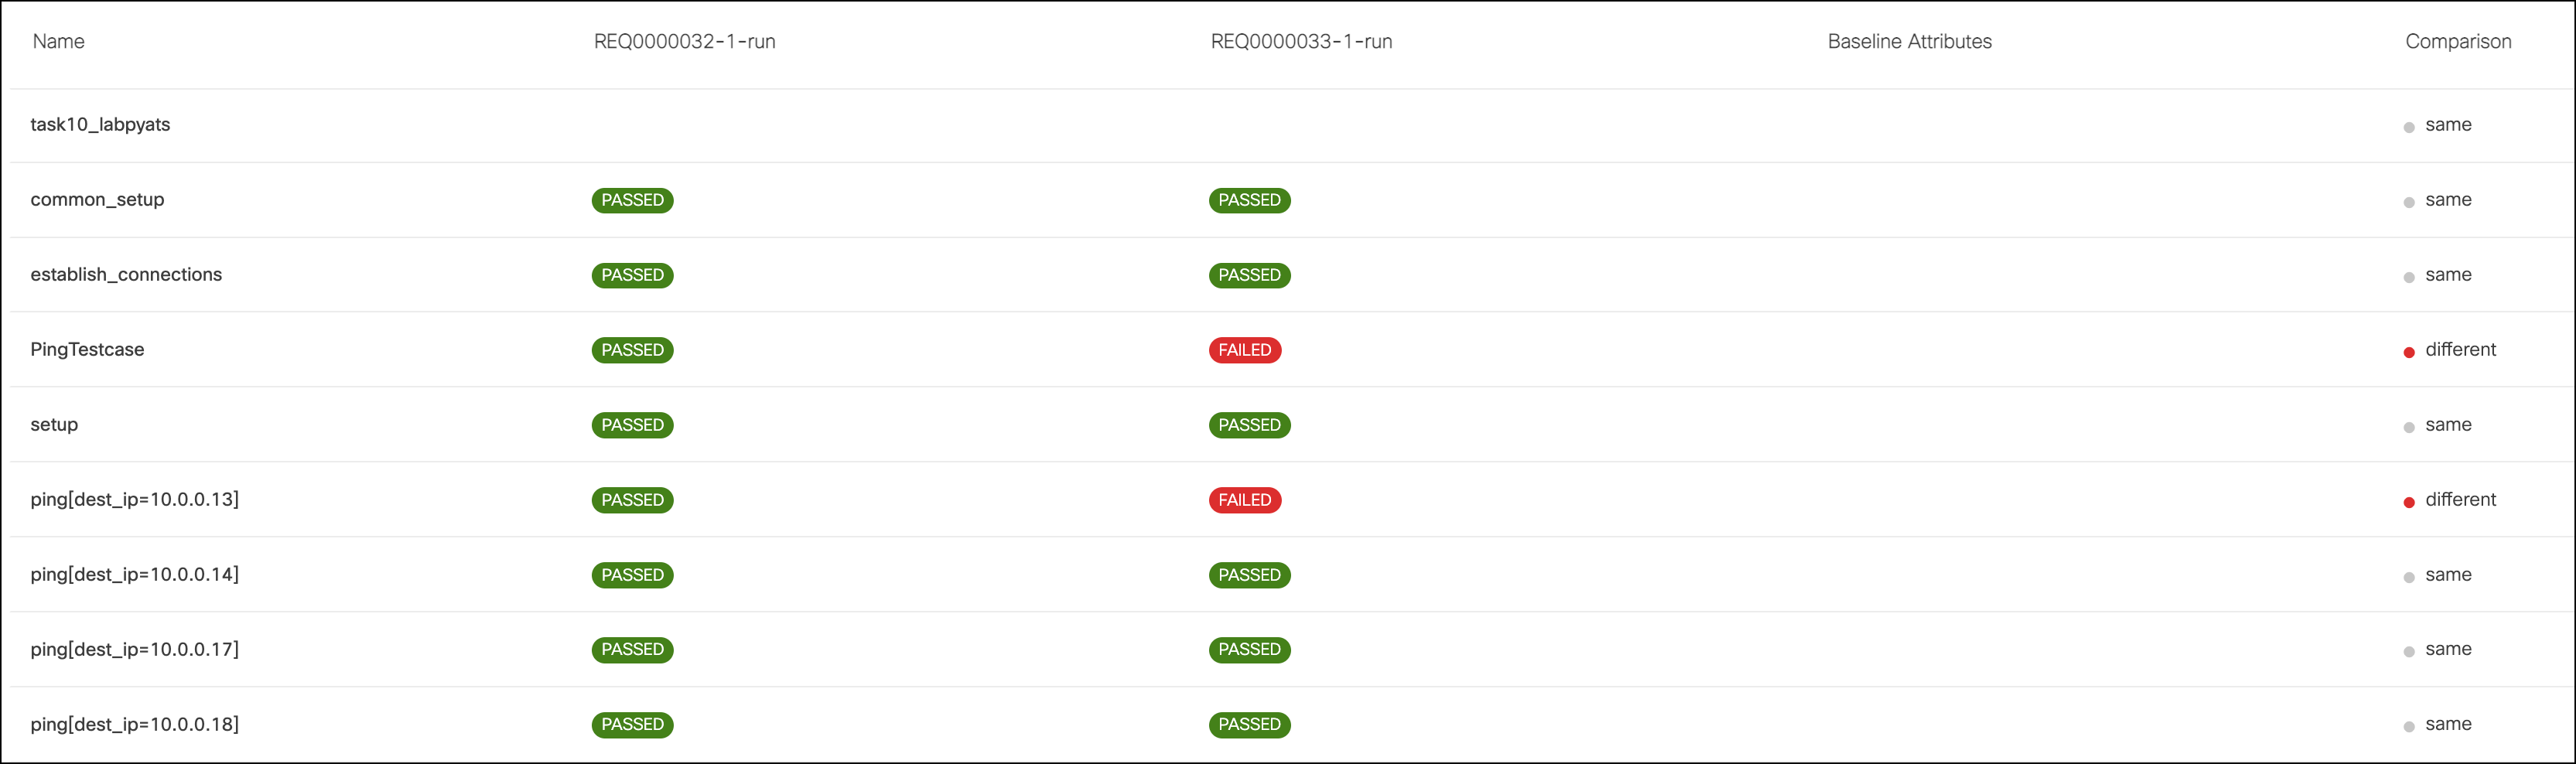
Followed by a detailed test to test comparison:
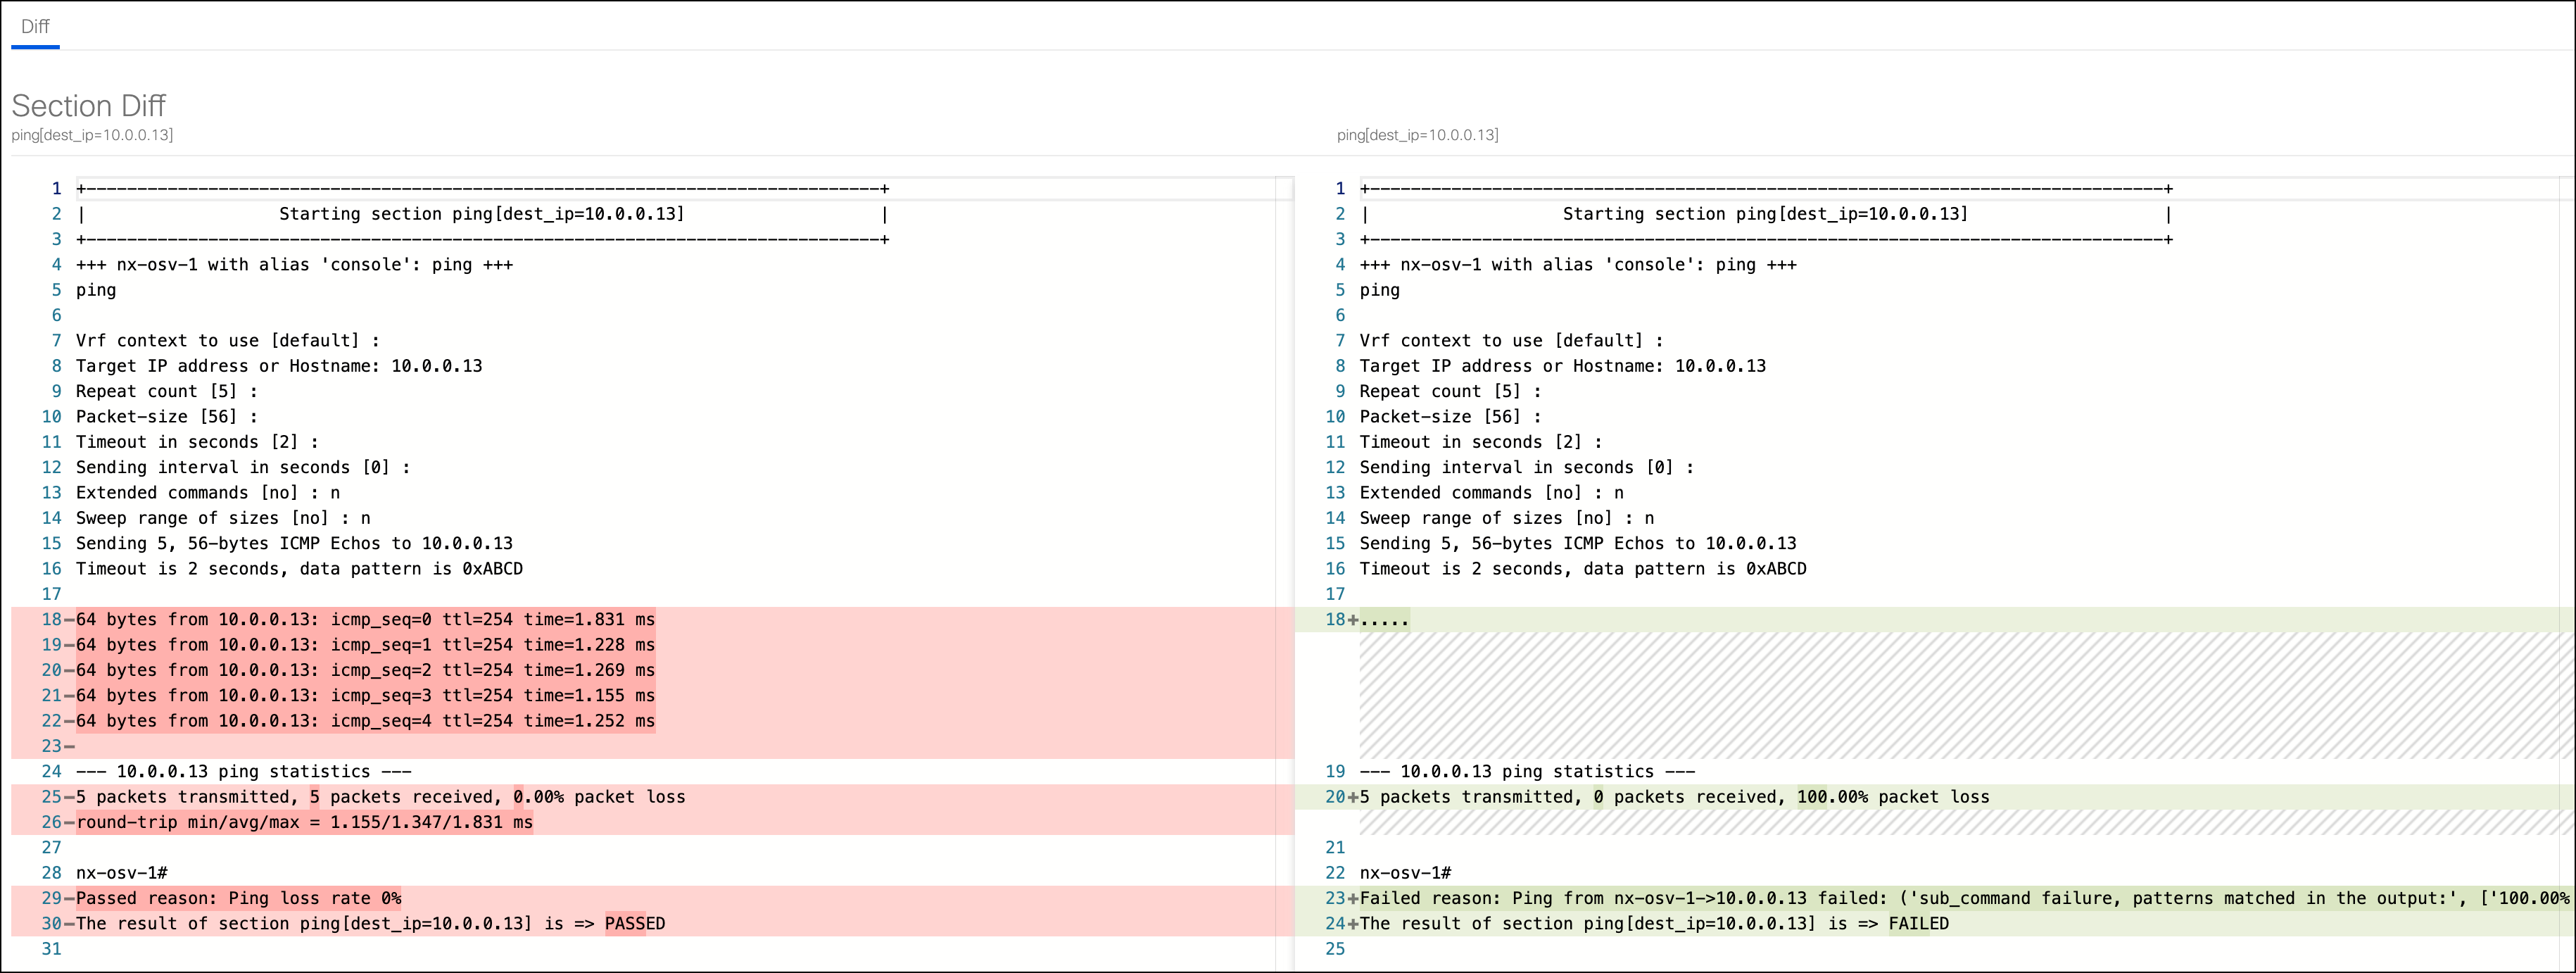
Hover the mouse over the failing test line ping[dest_ip=10.0.0.13], and click Testcase Diff icon on the right to see the test result in diff format:

Section diff page will open and load the diff plugin:
Note
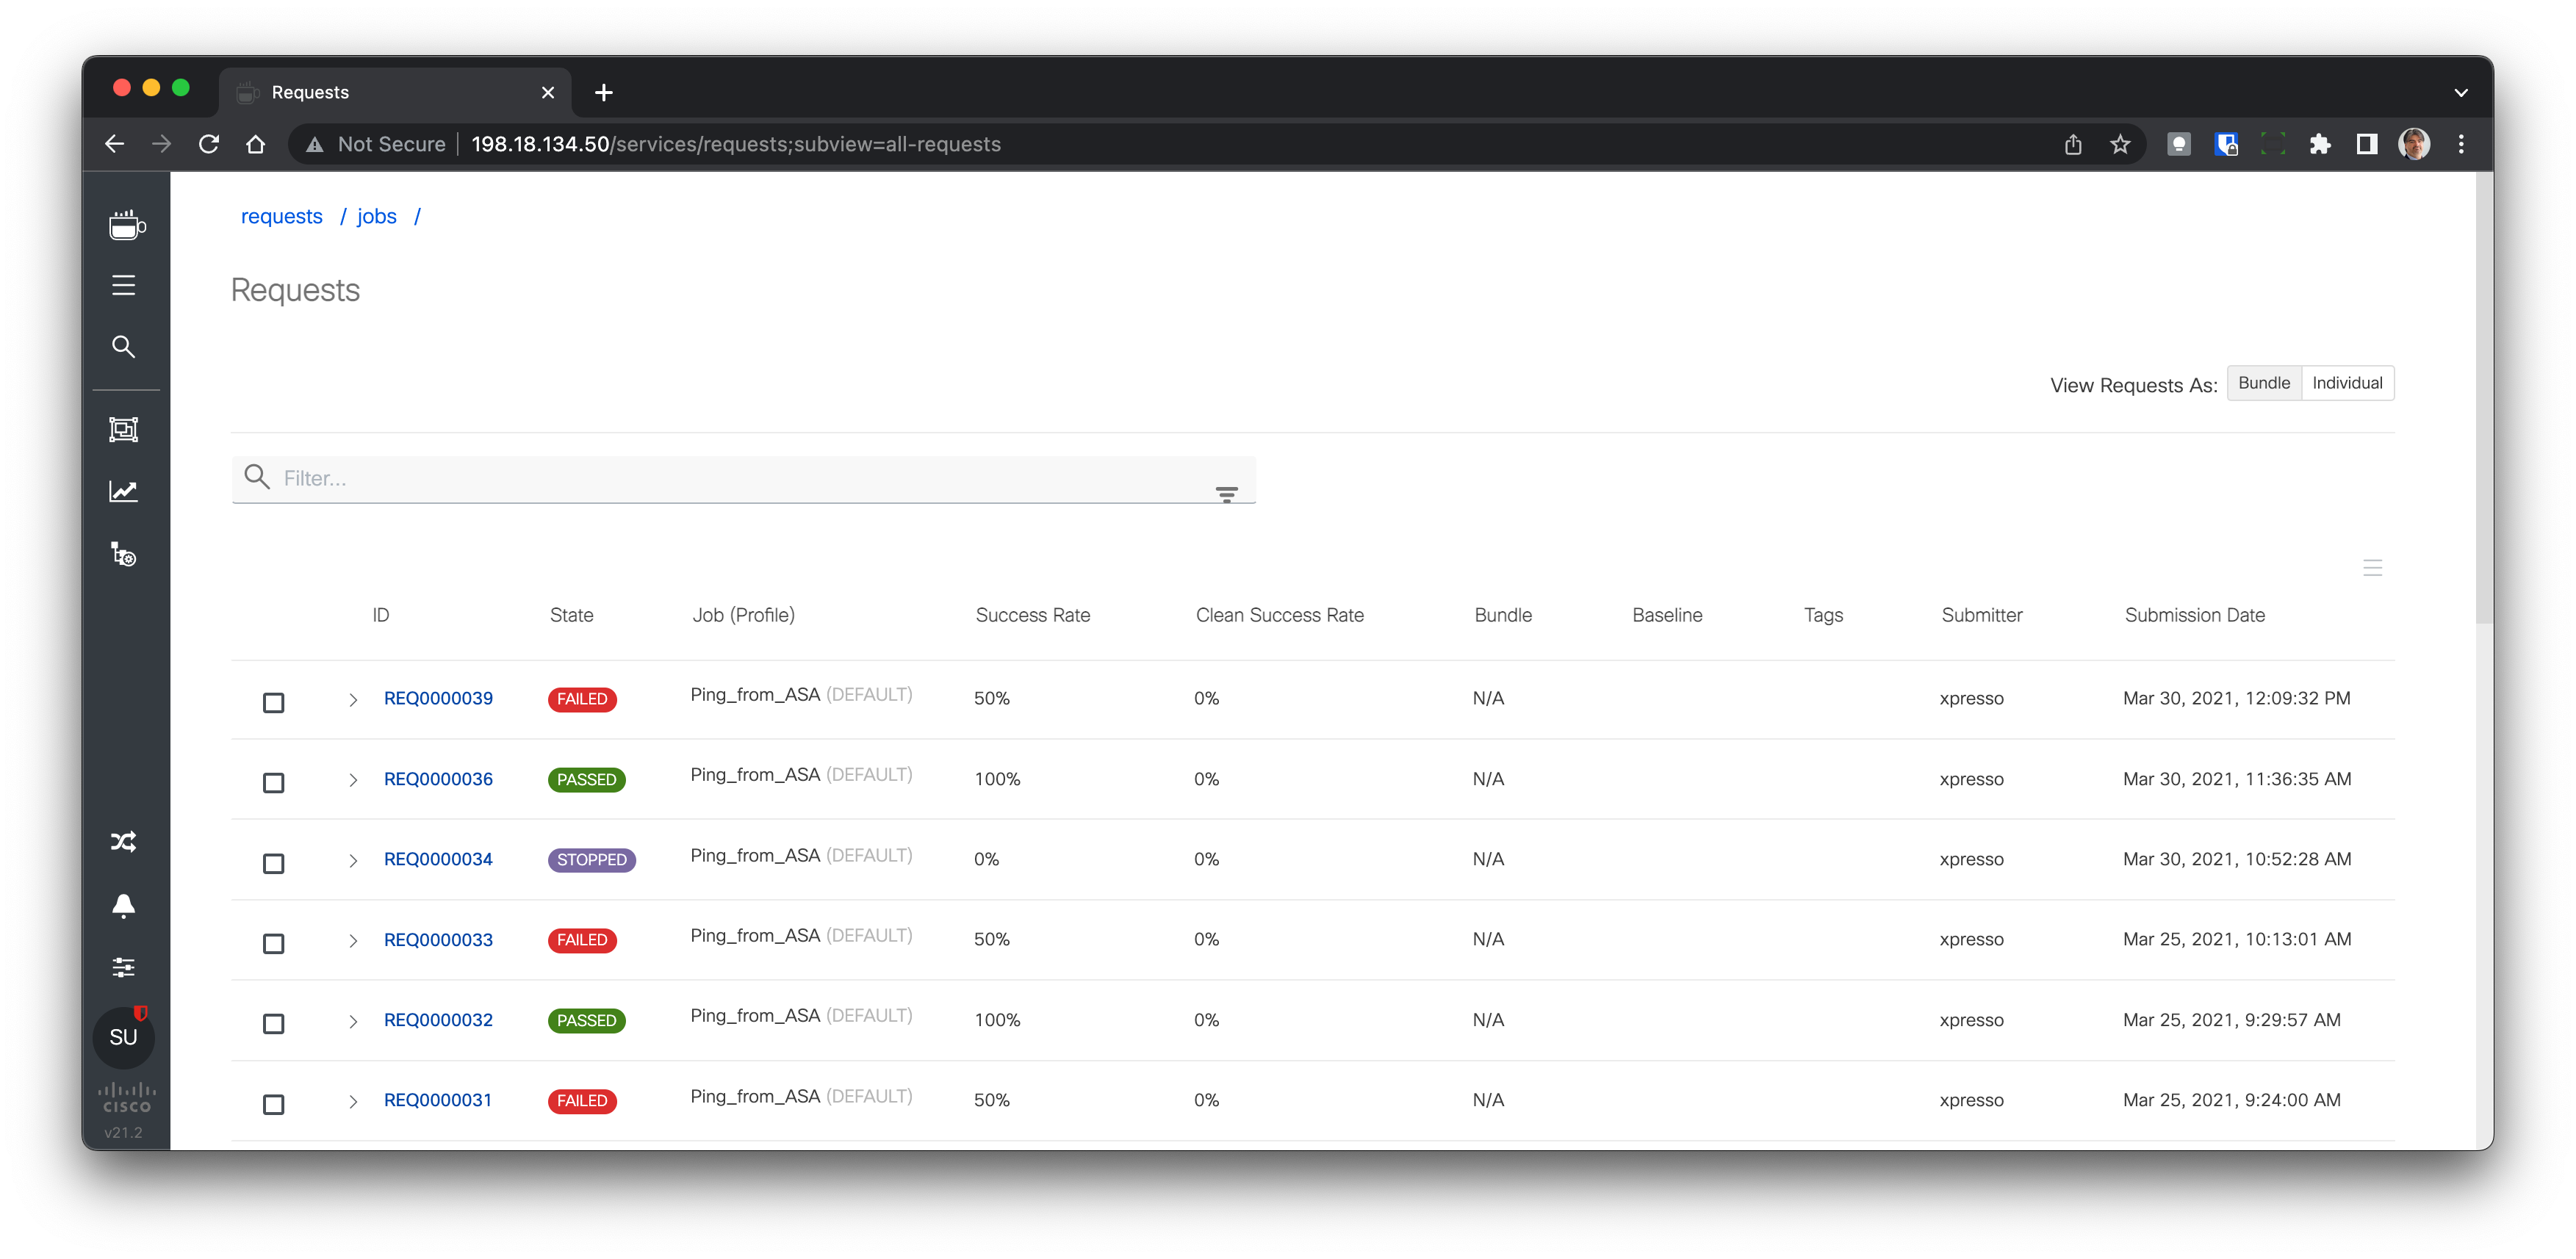
Alternatively, you can compare test results by going to the Requests page and selecting 2 requests for comparison as described below.
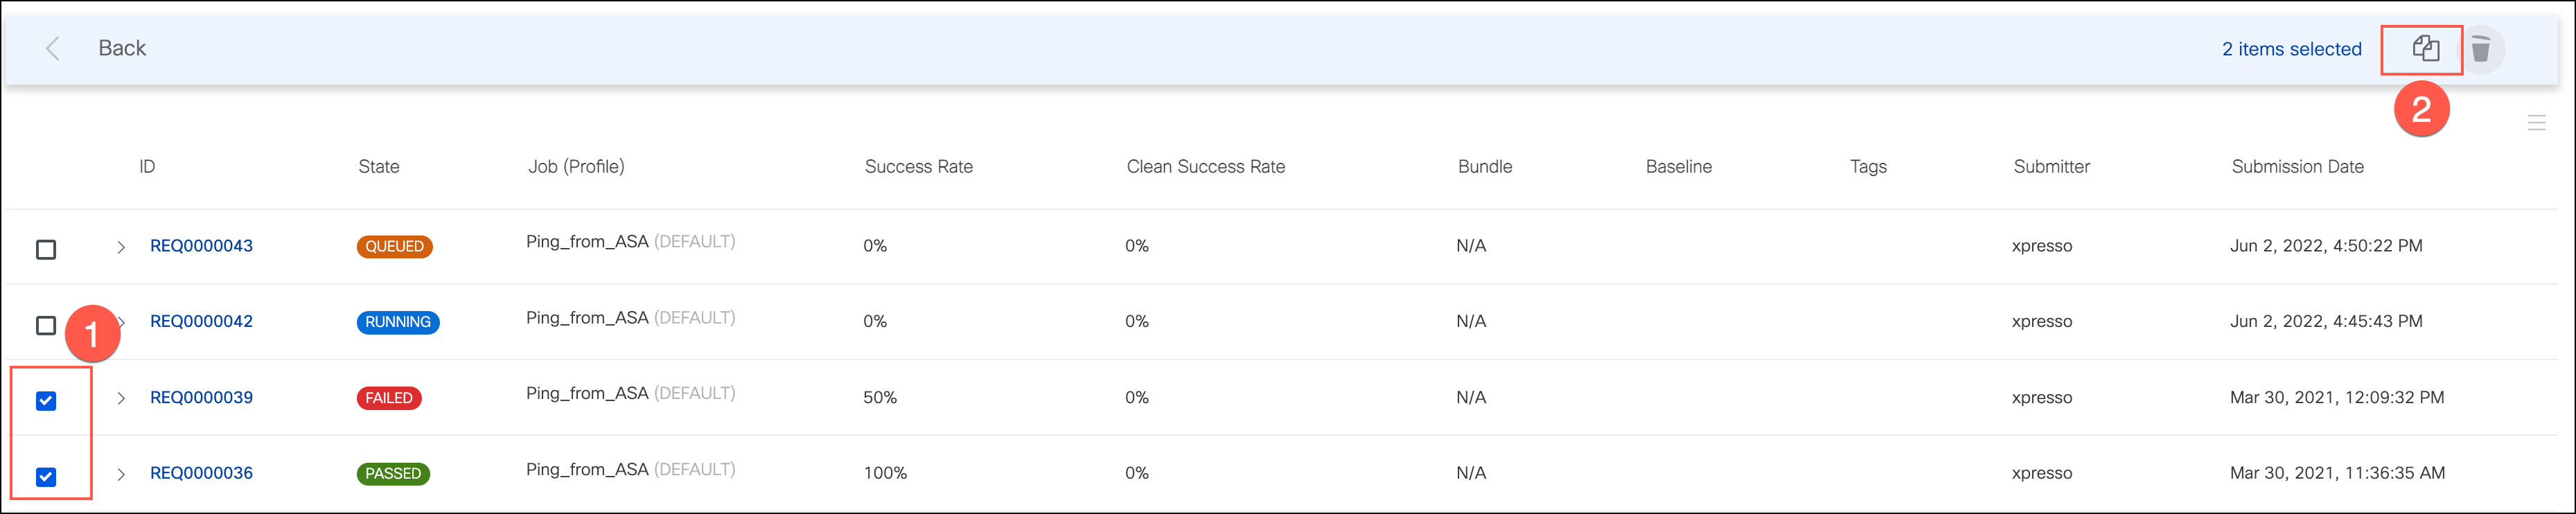
Click on the Requests menu item:
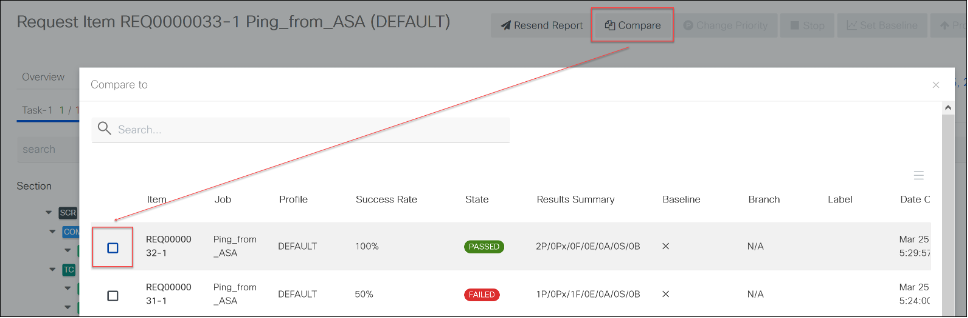
Select 2 requests - PASSED and FAILED, and click the Compare icon on the top right of the page. The compare icon will be visible only if you select exactly 2 items:
Select 2 results for comparison and click Compare icon. This additional step is required as Job can include several requests run as Job Bundle:
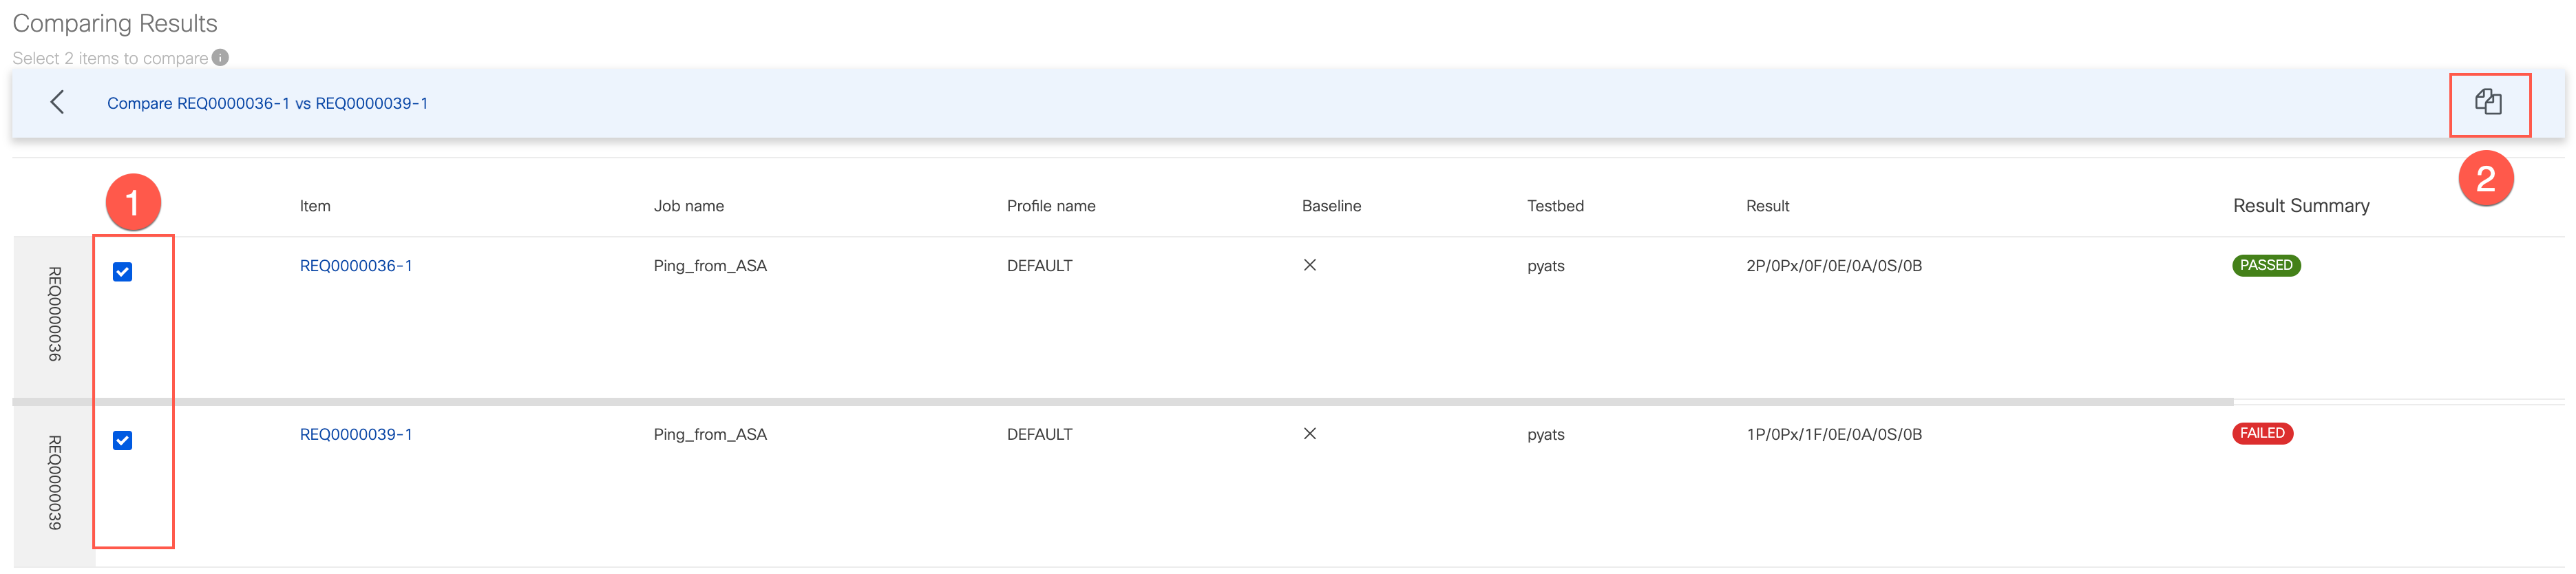
You will be brought to the results comparison page:
Section author: Luis Rueda <lurueda@cisco.com>, Jairo Leon <jaileon@cisco.com>